

Steven Gray, CFA
Head of Global Emerging Market &
Asia Regional Value Equities
Eastspring Singapore
Sept 2025|5 min read
Executive Summary
- Despite delivering robust returns so far in 2025, Emerging Markets remain significantly cheaper and account for a disproportionately small share of global equity assets.
- A weakening US dollar, room for Emerging Markets’ central banks to cut rates, and China’s renewed growth momentum are all aligning to support EM outperformance.
- Companies in Emerging Markets are increasingly prioritising shareholder returns. This shift signals a stronger and more attractive investment environment for global investors.
Emerging Markets (EMs) are delivering standout value and returns. With 17.0% net gains to end July, EMs have outperformed Developed Markets (DMs), which lagged at 13.1%. Yet, despite this outperformance, EMs remain deeply undervalued: at 14x forward price-to-earnings, they are 30% cheaper than DMs and a striking 42% cheaper than the US1. Add in the low price-to-book ratios and higher dividend yields versus the US, and the case for EMs becomes more compelling.
Yet EMs have yet to see meaningful inflows. They still account for just 5% of global equity assets under management which is only half of their 10% weight in the MSCI All Country World Index (ACWI) despite representing 84% of global population and 60% of global GDP2. Meanwhile with US equity concentration at record highs, even a small pullback in foreign ownership could unleash trillions in potential outflows. A modest shift of these outflows into EMs could have a significant impact.
Fig 1: EMs are under owned
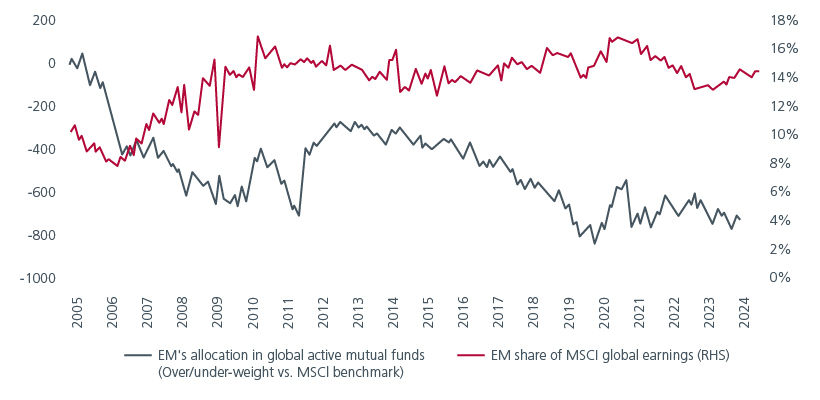
Source: EPFR, FactSet, MSCI, Goldman Sachs Global Investment Research as of 31 July 2025. Note: Global funds include both global & global ex-USA mandates
Arguably, valuation alone usually has not been enough of a support for EMs but when markets turn, it becomes a powerful driver. After a very long period of EMs’ underperformance, encouraging indications of turning points for EMs-versus-DMs are emerging.
US dollar weakness favours EMs
Primary amongst these is dollar weakness; over the long term, there is a very strong inverse correlation between the trade-weighted dollar and EM/DM relative performance. Historically, the trade-weighted dollar has moved in very long cycles; the shortest in the last 40 years was 6.5 years whilst the 15-year cycle of dollar strength from 2010 has been the longest – but may have peaked.
Fig 2: EMs outperform during periods of US dollar weakness
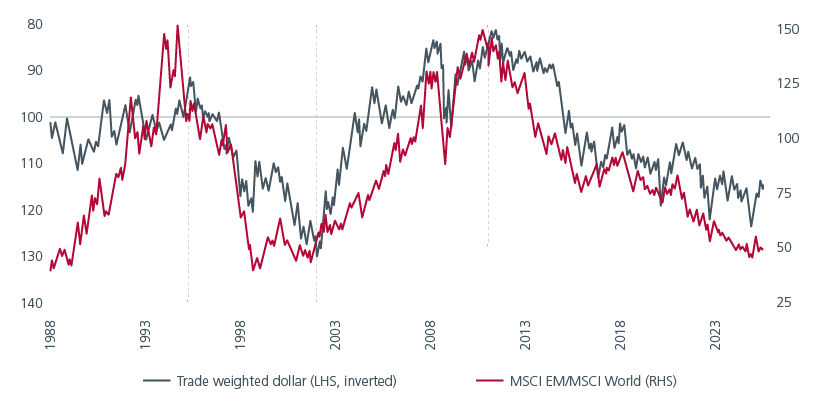
Source: CLSA, Federal Reserve, BIS, MSCI as of 31 July 2025
On several counts, like the US equity market, the US dollar looks overvalued and over owned: for example, the dollar accounts for 58% of global foreign exchange reserves but only 16% of trade3. Furthermore, EMs have lower US sales revenue exposure (~13%) compared to Japan and Europe (~20%), making EMs’ earnings less sensitive to a weaker dollar,4 all else being equal.
Meanwhile expectations for US Fed Funds rate cuts in 2H25 and beyond are weighing on the US dollar, keeping it weak. Concerns around US debt sustainability are growing, with all three major rating agencies now having downgraded US government debt. Adding to this, President Trump has openly stated his preference for a weaker dollar and is expected to pursue policies aimed at curbing dollar strength.
EMs have room to ease
A weaker dollar typically gives EMs' central banks room to cut rates. In fact, EMs have considerable scope to cut rates given their well-controlled inflation, historically high market-weighted real rates of ~ 3%5 and lower debt-to-GDP ratios than DMs.
Fig 3: EMs have relatively strong balance sheets
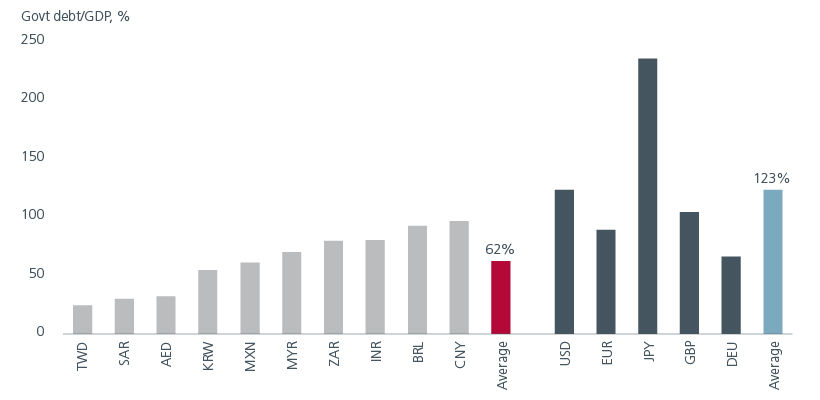
Source: IMF World Economic Outlook, April 2025
India is an interesting example, surprising the market with a larger than expected 50bp policy cut recently, and then being upgraded by Standard & Poor’s on 14 August (earlier than expected). Up to 19 EMs are expected to cut rates this year, with Brazil leading over the next 18 months. Historically, EMs outperform DMs during easing cycles — provided global growth is benign as it is now. The only times EMs did not outperform despite central bank easing was during the Asian currency crisis and Covid-19 pandemic.
China’s recovery eases pressure on EMs
The third important turning point pertains to the market performance of China versus the US, particularly since 2020. The stark divergence between MSCI EM’s 10% total return and MSCI World’s 70% over the four years to end-2024 highlights China’s drag versus the US boost — yet excluding both, EM ex-China returned 28%, nearly matching World ex-US at 30%.6
Whether the very expensive US market can continue to outperform from current levels, despite dollar weakness, is debatable. However, China’s strong performance in 2025 so far bodes well for EMs. China’s commitment to 5% growth is backed by targeted stimulus — including expanded fiscal spending, bond issuance, and rate cuts — aimed at boosting consumption through trade-in programmes, social subsidies, and sector-specific lending.
Chinese households sit on USD22tn in deposits which could be a powerful catalyst for spending and hence growth if confidence returns. From an equity market perspective, the technology arms race has led to some relaxation over the private sector, with DeepSeek having invigorated the technology sector. Elsewhere, the massive drag from the property downcycle is at least stabilising whilst initiatives such as the anti-involution policy may lead to a better focus on returns.
Tariff uncertainty remains a headwind
The greatest market fear today is whether rising tariffs will destabilise the potential for EMs to outperform. While tariffs are widely seen as a drag on global growth, their relative impact on the US versus affected economies remains debated. With shifting tariff levels, timelines, and exemptions, the implications for EMs — both versus World ex-US and within EMs themselves — are still unclear.
So far, with some notable exceptions i.e. Brazil and India, regional tariffs have gravitated towards similar levels, negating competitive impacts within those regions; ASEAN tariffs, for example, are 19%-20%, although China’s continuously delayed tariffs remain a question mark. While the US remains a key market, most EMs have steadily reduced export reliance on it, increasing intra-EM trade instead. This trend is accelerating, with new trade agreements across Asia and renewed BRIC collaboration following tariff pressures.
Upside potential from shareholder focus
Across EMs, there's growing emphasis on shareholder returns, inspired by Japan’s success. India’s capital guidelines for public sector undertakings drove strong stock performance, while China’s CSRC has issued governance-focused reforms. Korea’s “value-up” efforts have lagged, but rising retail investor pressure may drive change, with nearly 70% of companies still trading below book value.
Historically, EMs were known for equity dilution due to frequent capital raising. EMs now offer a higher total yield than the US, driven by stronger dividend payouts, even though buybacks are lower. This signals a shift towards more shareholder-friendly capital allocation. The current trend of reduced dilution and rising payouts marks a structural improvement in capital discipline. With over 40% of EM companies enjoying net cash (versus less than 20% in DMs),7 there remains more scope for even higher payouts and buybacks.
Fig 4: EMs' equity yield is catching up
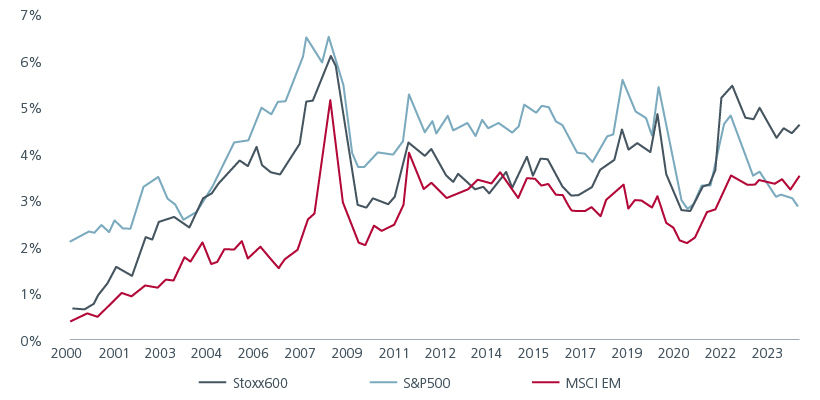
Source: JP Morgan as of 31 December 2024
EM Value is a high beta play on EM recovery
Given the above observations, EMs present one of the most compelling opportunities to outperform DMs in over 15 years. Within EMs, the case for EM Value is even stronger. Historically, EM Value has outperformed the broader EM index during periods of EMs' outperformance versus DMs (and vice versa) – as evident from the EMs' outperformance from 2000 to 2010 and mostly EMs' underperformance since then. The only exception being during Covid-19 when EM Value massively underperformed during the initial shock of lockdowns but subsequently rebounded off a very low base.
To a large extent, EM Value magnifies the issues and opportunities of EMs. When EMs are unloved, investors tend to crowd in a few popular sectors with stronger long-term growth and higher quality factors; as a result, the valuation dispersion, measured as the price-to-earnings ratio of the most expensive quartile of stocks over the least expensive quartile, increases. When investor interest returns to EMs, valuation gaps typically narrow. Investors adding to EMs should consider an allocation to EM Value for potentially higher beta as EMs regain ground against DMs.
Interesting reads


Sources:
1 Bloomberg, 31 Aug 2025
2 IMF, Bloomberg, HSBC, as at 31 December 2024
3 International Monetary Fund as at 31 December 2024
4 UBS, Refinitiv Datastream, HOLT as at 25 June 2025
5 Haver, Morgan Stanley Research as of 30 June 2025
6 MSCI indices
7 Jeffries Factset as at 31 March 2024.
The information and views expressed herein do not constitute an offer or solicitation to deal in shares of any securities or financial instruments and it is not intended for distribution or use by anyone or entity located in any jurisdiction where such distribution would be unlawful or prohibited. The information does not constitute investment advice or an offer to provide investment advisory or investment management service or the solicitation of an offer to provide investment advisory or investment management services in any jurisdiction in which an offer or solicitation would be unlawful under the securities laws of that jurisdiction.
Past performance and the predictions, projections, or forecasts on the economy, securities markets or the economic trends of the markets are not necessarily indicative of the future or likely performance of Eastspring Investments or any of the strategies managed by Eastspring Investments. An investment is subject to investment risks, including the possible loss of the principal amount invested. Where an investment is denominated in another currency, exchange rates may have an adverse effect on the value price or income of that investment. Furthermore, exposure to a single country market, specific portfolio composition or management techniques may potentially increase volatility.
Any securities mentioned are included for illustration purposes only. It should not be considered a recommendation to purchase or sell such securities. There is no assurance that any security discussed herein will remain in the portfolio at the time you receive this document or that security sold has not been repurchased.
The information provided herein is believed to be reliable at time of publication and based on matters as they exist as of the date of preparation of this report and not as of any future date. Eastspring Investments undertakes no (and disclaims any) obligation to update, modify or amend this document or to otherwise notify you in the event that any matter stated in the materials, or any opinion, projection, forecast or estimate set forth in the document, changes or subsequently becomes inaccurate. Eastspring Investments personnel may develop views and opinions that are not stated in the materials or that are contrary to the views and opinions stated in the materials at any time and from time to time as the result of a negative factor that comes to its attention in respect to an investment or for any other reason or for no reason. Eastspring Investments shall not and shall have no duty to notify you of any such views and opinions. This document is solely for information and does not have any regard to the specific investment objectives, financial or tax situation and the particular needs of any specific person who may receive this document.
Eastspring Investments Inc. (Eastspring US) primary activity is to provide certain marketing, sales servicing, and client support in the US on behalf of Eastspring Investment (Singapore) Limited (“Eastspring Singapore”). Eastspring Singapore is an affiliated investment management entity that is domiciled and registered under, among other regulatory bodies, the Monetary Authority of Singapore (MAS). Eastspring Singapore and Eastspring US are both registered with the US Securities and Exchange Commission as a registered investment adviser. Registration as an adviser does not imply a level of skill or training. Eastspring US seeks to identify and introduce to Eastspring Singapore potential institutional client prospects. Such prospects, once introduced, would contract directly with Eastspring Singapore for any investment management or advisory services. Additional information about Eastspring Singapore and Eastspring US is also is available on the SEC’s website at www.adviserinfo.sec. gov.
Certain information contained herein constitutes "forward-looking statements", which can be identified by the use of forward-looking terminology such as "may", "will", "should", "expect", "anticipate", "project", "estimate", "intend", "continue" or "believe" or the negatives thereof, other variations thereof or comparable terminology. Such information is based on expectations, estimates and projections (and assumptions underlying such information) and cannot be relied upon as a guarantee of future performance. Due to various risks and uncertainties, actual events or results, or the actual performance of any fund may differ materially from those reflected or contemplated in such forward-looking statements.
Eastspring Investments companies (excluding JV companies) are ultimately wholly-owned / indirect subsidiaries / associate of Prudential plc of the United Kingdom. Eastspring Investments companies (including JV’s) and Prudential plc are not affiliated in any manner with Prudential Financial, Inc., a company whose principal place of business is in the United States of America.