


Executive Summary
- Transition leaders are strategic additions in a forward-looking portfolio, as they not only advance global climate goals, but also unlock long-term value for investors.
- Companies leading the climate transition capture transition revenue opportunities and are also committed to carbon reduction in a manner practical to their operations. They include companies that develop climate mitigation solutions as well as those that enable climate adaptation.
- In trying to identify transition leaders, it is key to guard against transition washing. It is also important to be mindful of any potential unconscious bias against Emerging Markets and certain high emissions sectors.
This is the last of our 3-part series on Just transition – the process of shifting to a more sustainable economy in a way that is fair and inclusive. In our first article, we made the case that tapping into companies early in their transition journey can be extremely rewarding for investors. In our second article, we demonstrated how active sustainability-themed engagement can drive corporate changes, or result in enhanced due diligence that can ultimately lead to enhanced long-term financial performance and value creation. In this article, we share how investors can spot future climate transition leaders, amid the rapidly evolving landscape of climate policies and technologies, and lack of standardised reporting.
Besides helping to advance climate action, climate transition leaders also enjoy other business benefits. In a recent survey of Emerging Market (EM) companies, 69% of the companies surveyed felt that sustainability enhanced their core business, with Asian companies scoring highest at 81%. See Fig. 1. Meanwhile, 64% viewed sustainability as an opportunity to show industry leadership, including enhanced reputation and credibility. Fig. 2. Hence, adding transition leaders in investment portfolios can potentially improve return outcomes over the long term.
Fig. 1. % of respondents who feel that sustainability enhances core business activities
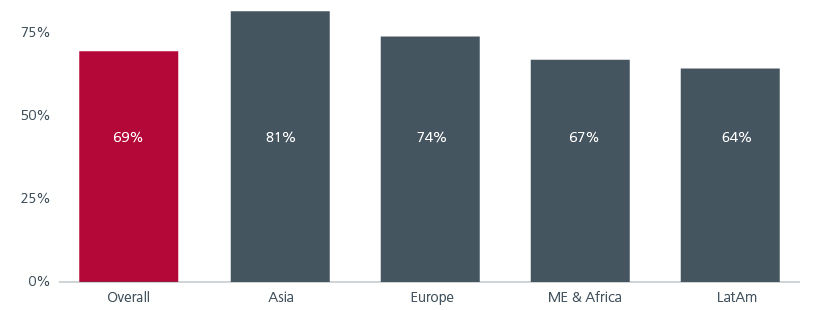
Source: BofA Global Research. EM issuer sustainability survey: results. June 2025.
Fig. 2. % of respondents who believe that sustainability helps enhance industry leadership
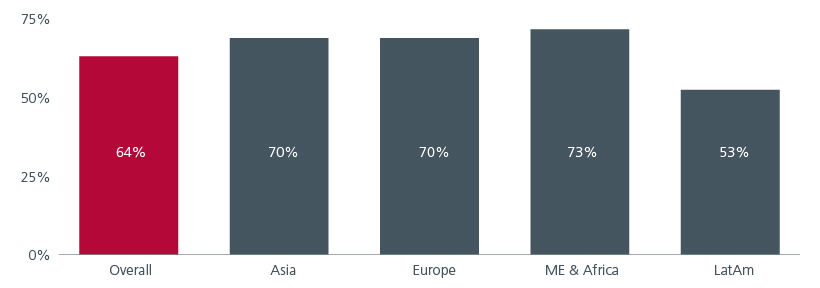
Source: BofA Global Research. EM issuer sustainability survey: results. June 2025.
The marks of a leader
What defines a climate transition leader? Is it a company that excels at capturing transition revenue opportunities (doing more good) or one that strongly demonstrates a genuine commitment to reducing its carbon emissions (doing less bad)? Should the focus be on companies that develop climate mitigation solutions (such as clean energy and carbon capture) or those that enable climate adaptation (like water management and resilient infrastructure)? We believe that the answer should be “all of the above”, with certain tilts making more sense for companies in their respective sectors and markets of operations. Context-specificity is required to potentially spot growth that takes advantage of solving for market opportunities and deliver product-impact in a climate changed world
The challenge for investors is to identify these companies in a systematic manner that balances scale/ coverage and uniformity-of-approach. This is even more difficult in EMs given the different climate taxonomies across the region, the varying stages of economic and industry development, as well as the differences in the quantity and quality of data available.
In trying to identify transition leaders, it is key to guard against transition washing – where claims, acts or omissions give the impression that a company is transitioning to a more sustainable operating model than it actually is. It is also equally important to be mindful of any potential unconscious bias against EMs and certain high emissions sectors by over emphasizing public and/or certified net zero pledges as these commitments can be affected by data availability, different stages of disclosure maturity and/or consideration of each country’s Nationally Determined Contribution (NDC). While we do consider the progress made on these fronts, we encourage an open approach that considers business-cycle variations across the investment cycles. In other words, these parameters should not be taken as a limiting factor upfront but should be considered in the context of how they evolve in parallel with concrete actions, macro-changes and cashflow management for climate transition at the business-level over time.
Screening for winners
In September 2024, Eastspring Investments and Prudential launched the Eastspring-Prudential Framework for Climate Transition Investing, endorsed by the Climate Bonds Initiative1. The framework guides asset owners in navigating investments in climate transition.
We believe that investors can evaluate companies’ efforts by measuring effort, performance and positive macro exposure across transition opportunities and emission reduction efforts. Fig. 3. Our framework includes companies that are involved in climate mitigation and adaptation solutions as climate-induced reductions in quality of life are almost guaranteed to happen2. Therefore, adaptation solutions are essential in encompassing the social element in a climate transition, and present real investable opportunities.
When evaluating transition opportunities, our framework assesses a company’s entire product development and sales cycle by looking at indicators such as patents, green and transition capital expenditure (CAPEX) as well as green revenue activity. While high quality patents can be a proxy for future transition business growth, the measure carries risks as a singular screen, as not all patents will become commercial products. Meanwhile focusing only on revenue is less forward-looking. On the other hand, focusing only on Green CAPEX may sideline sectors where maintenance CAPEX, instead of growth CAPEX, is needed for energy efficiency upgrades. We therefore try and evaluate businesses holistically along their value chain.
Fig. 3. Assessing companies’ transition activities
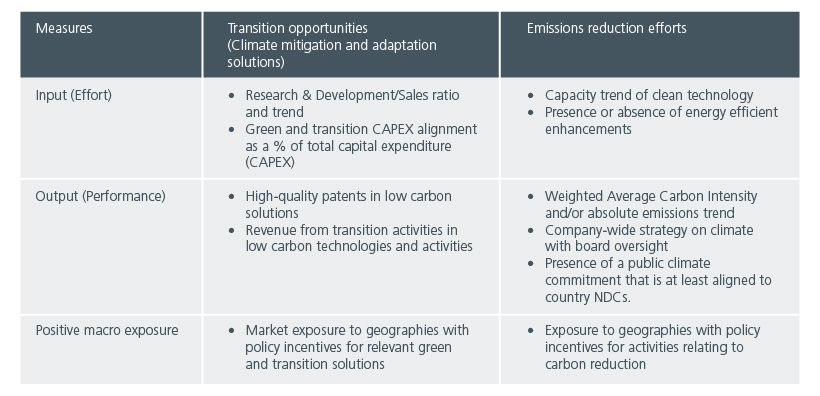
Source: Framework for investing in climate transition in the capital markets. With a case study: Eastspring Just Transition Portfolio. September 2024.
Proprietary inputs from external ESG and market data providers as well as internal metrics are used to assign scores to companies based on the above components. These quantitative scores help to differentiate the transition progress for each company, focusing on the incremental changes going forward. This screening helps to achieve a more concentrated universe of investable opportunities.
A strategic addition
Companies at the forefront of the sustainability transition not only contribute to global climate goals, but also unlock long-term value, making them strategic additions in a forward-looking portfolio.
The recent escalation in geopolitical tensions and strategic rivalries have dampened climate finance flows, particularly affecting mitigation efforts in EMs3. Against this backdrop, investor influence becomes even more critical. In the survey mentioned earlier, 62% of EM companies surveyed cited investor demand as a key driver of their sustainability efforts. This highlights the pivotal role asset owners and investors can play—not just in identifying transition leaders, but in actively shaping the climate transition. By directing capital toward companies demonstrating credible and impactful climate strategies, investors can accelerate the shift to a low-carbon economy while potentially enjoying superior outcomes over the long term.
Tariff uncertainty remains a headwind
The greatest market fear today is whether rising tariffs will destabilise the potential for EMs to outperform. While tariffs are widely seen as a drag on global growth, their relative impact on the US versus affected economies remains debated. With shifting tariff levels, timelines, and exemptions, the implications for EMs — both versus World ex-US and within EMs themselves — are still unclear.
So far, with some notable exceptions i.e. Brazil and India, regional tariffs have gravitated towards similar levels, negating competitive impacts within those regions; ASEAN tariffs, for example, are 19%-20%, although China’s continuously delayed tariffs remain a question mark. While the US remains a key market, most EMs have steadily reduced export reliance on it, increasing intra-EM trade instead. This trend is accelerating, with new trade agreements across Asia and renewed BRIC collaboration following tariff pressures.
Upside potential from shareholder focus
Across EMs, there's growing emphasis on shareholder returns, inspired by Japan’s success. India’s capital guidelines for public sector undertakings drove strong stock performance, while China’s CSRC has issued governance-focused reforms. Korea’s “value-up” efforts have lagged, but rising retail investor pressure may drive change, with nearly 70% of companies still trading below book value.
Historically, EMs were known for equity dilution due to frequent capital raising. EMs now offer a higher total yield than the US, driven by stronger dividend payouts, even though buybacks are lower. This signals a shift towards more shareholder-friendly capital allocation. The current trend of reduced dilution and rising payouts marks a structural improvement in capital discipline. With over 40% of EM companies enjoying net cash (versus less than 20% in DMs),7 there remains more scope for even higher payouts and buybacks.
Fig 4: EMs' equity yield is catching up
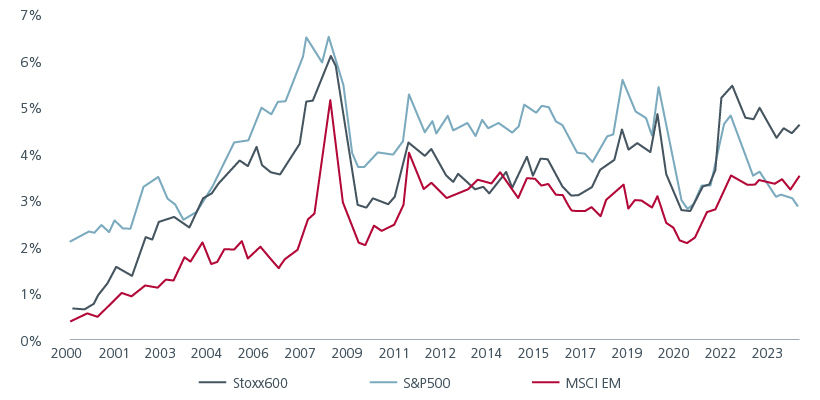
Source: JP Morgan as of 31 December 2024
EM Value is a high beta play on EM recovery
Given the above observations, EMs present one of the most compelling opportunities to outperform DMs in over 15 years. Within EMs, the case for EM Value is even stronger. Historically, EM Value has outperformed the broader EM index during periods of EMs' outperformance versus DMs (and vice versa) – as evident from the EMs' outperformance from 2000 to 2010 and mostly EMs' underperformance since then. The only exception being during Covid-19 when EM Value massively underperformed during the initial shock of lockdowns but subsequently rebounded off a very low base.
To a large extent, EM Value magnifies the issues and opportunities of EMs. When EMs are unloved, investors tend to crowd in a few popular sectors with stronger long-term growth and higher quality factors; as a result, the valuation dispersion, measured as the price-to-earnings ratio of the most expensive quartile of stocks over the least expensive quartile, increases. When investor interest returns to EMs, valuation gaps typically narrow. Investors adding to EMs should consider an allocation to EM Value for potentially higher beta as EMs regain ground against DMs.
Interesting reads


Sources:
1 CBI is a leading international non-governmental organisation mobilising and setting standards for global capital for climate action.
2 The Intergovernmental Panel on Climate Change’s 6th Assessment Report states that a 1.50C future might be very difficult to reach without immediate and drastic decarbonisation.
3 Institute of International Finance. The high stakes of delaying climate action in EMDEs.
The information and views expressed herein do not constitute an offer or solicitation to deal in shares of any securities or financial instruments and it is not intended for distribution or use by anyone or entity located in any jurisdiction where such distribution would be unlawful or prohibited. The information does not constitute investment advice or an offer to provide investment advisory or investment management service or the solicitation of an offer to provide investment advisory or investment management services in any jurisdiction in which an offer or solicitation would be unlawful under the securities laws of that jurisdiction.
Past performance and the predictions, projections, or forecasts on the economy, securities markets or the economic trends of the markets are not necessarily indicative of the future or likely performance of Eastspring Investments or any of the strategies managed by Eastspring Investments. An investment is subject to investment risks, including the possible loss of the principal amount invested. Where an investment is denominated in another currency, exchange rates may have an adverse effect on the value price or income of that investment. Furthermore, exposure to a single country market, specific portfolio composition or management techniques may potentially increase volatility.
Any securities mentioned are included for illustration purposes only. It should not be considered a recommendation to purchase or sell such securities. There is no assurance that any security discussed herein will remain in the portfolio at the time you receive this document or that security sold has not been repurchased.
The information provided herein is believed to be reliable at time of publication and based on matters as they exist as of the date of preparation of this report and not as of any future date. Eastspring Investments undertakes no (and disclaims any) obligation to update, modify or amend this document or to otherwise notify you in the event that any matter stated in the materials, or any opinion, projection, forecast or estimate set forth in the document, changes or subsequently becomes inaccurate. Eastspring Investments personnel may develop views and opinions that are not stated in the materials or that are contrary to the views and opinions stated in the materials at any time and from time to time as the result of a negative factor that comes to its attention in respect to an investment or for any other reason or for no reason. Eastspring Investments shall not and shall have no duty to notify you of any such views and opinions. This document is solely for information and does not have any regard to the specific investment objectives, financial or tax situation and the particular needs of any specific person who may receive this document.
Eastspring Investments Inc. (Eastspring US) primary activity is to provide certain marketing, sales servicing, and client support in the US on behalf of Eastspring Investment (Singapore) Limited (“Eastspring Singapore”). Eastspring Singapore is an affiliated investment management entity that is domiciled and registered under, among other regulatory bodies, the Monetary Authority of Singapore (MAS). Eastspring Singapore and Eastspring US are both registered with the US Securities and Exchange Commission as a registered investment adviser. Registration as an adviser does not imply a level of skill or training. Eastspring US seeks to identify and introduce to Eastspring Singapore potential institutional client prospects. Such prospects, once introduced, would contract directly with Eastspring Singapore for any investment management or advisory services. Additional information about Eastspring Singapore and Eastspring US is also is available on the SEC’s website at www.adviserinfo.sec. gov.
Certain information contained herein constitutes "forward-looking statements", which can be identified by the use of forward-looking terminology such as "may", "will", "should", "expect", "anticipate", "project", "estimate", "intend", "continue" or "believe" or the negatives thereof, other variations thereof or comparable terminology. Such information is based on expectations, estimates and projections (and assumptions underlying such information) and cannot be relied upon as a guarantee of future performance. Due to various risks and uncertainties, actual events or results, or the actual performance of any fund may differ materially from those reflected or contemplated in such forward-looking statements.
Eastspring Investments companies (excluding JV companies) are ultimately wholly-owned / indirect subsidiaries / associate of Prudential plc of the United Kingdom. Eastspring Investments companies (including JV’s) and Prudential plc are not affiliated in any manner with Prudential Financial, Inc., a company whose principal place of business is in the United States of America.