


Executive Summary
- In a world where market dynamics are shifting and uncertainty is rising, active investing is no longer a preference but a necessity.
- This is especially so in Asia, where rising market and sector concentration within the MSCI Asia ex Japan Index potentially exposes passive investors to more risk than they realise.
- Active investors have the flexibility to seek out less popular stocks as well as opportunities outside the index. Historically in Asia, these stocks have traded at more attractive valuations and delivered rewarding outcomes.
The debate between active and passive investing is not new. But in today’s market, it deserves renewed attention. While passive investing—largely through index-tracking Exchange Traded Funds (ETFs)—offers simplicity and cost efficiency, the evolution of dominant market themes and new layers of complexity, particularly around trade and supply chains, demand a more active approach when investing in Asia.
Passive investing: Hidden risks
Passive investing’s low fees and broad market exposure have made it popular with investors. ETFs tracking indexes like MSCI AC Asia ex Japan allow investors to participate in the region’s opportunities without the need for deep research. But this efficiency comes with a cost.
As capital flows into passive vehicles, it creates a feedback loop. Larger companies—already prominent in the index—receives more inflows, which pushes their valuations higher, thereby reinforcing their dominance in the index. The result is a market that is increasingly driven by a handful of names. The chart below shows that since 2024, the largest companies in the Asia ex Japan investment universe have increasingly driven the region’s performance.
Fig. 1. Asia ex Japan universe* return contribution by the largest 5% of constituents
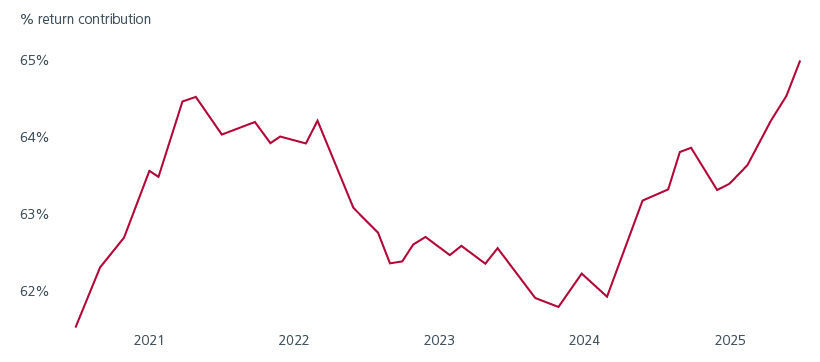
Source: Analysis window: 1 June 2020 to 30 June 2025. *Our proprietary Asia ex-Japan investment universe comprises stocks drawn from major indices—including S&P BMI Global, MSCI ACWI, MSCI Frontier, JCI, FTSE Bursa 100, among others (non-exhaustive). This universe is further refined to include only stocks listed in the following countries: Hong Kong, Singapore, China, India, Indonesia, South Korea, Malaysia, Philippines, Taiwan, Thailand, Bangladesh, Pakistan, Sri Lanka, and Vietnam.
This concentration introduces real risk. When a few companies account for a disproportionate share of the index performance, any weakness in those names can potentially drag down an entire portfolio. The top 10 constituents in the MSCI AC Asia ex Japan Index now account for 40% of the index’s risk. Fig. 2. Investors who thought they were buying “the market” are actually exposed to a narrow slice of it – nearly 40% of allocation in risk budget terms are coming from just 10 stocks, representing a mere 1% by count!
Fig. 2. MSCI AC Asia ex Japan index - risk contribution by the largest 10 constituents
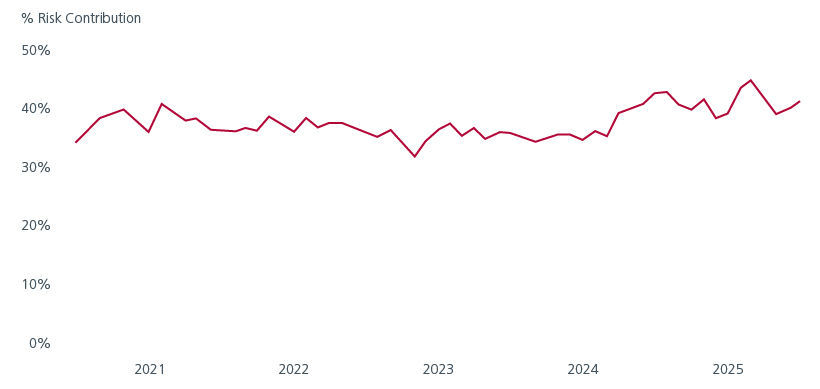
Source: Analysis window: 1 June 2020 to 30 June 2025. Axioma Fundamental Asia Pacific ex Japan Medium-Horizon.
Is the index still the market?
The assumption that an index represents the market is becoming less valid.
When we break down the index by country and sector, the concentration becomes even more apparent. Countries like China and Taiwan, and sectors such as Information Technology and Financials, account for the bulk of the exposure. Fig 3 and 4. This is not representative of the diverse Asia ex Japan opportunity set.
Fig. 3. MSCI AC Asia ex Japan Index – weight of largest 3 countries
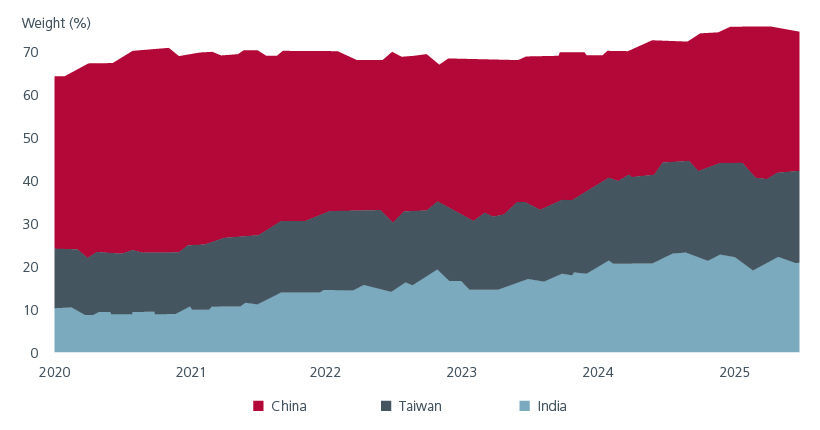
Source: Largest 3 countries by weight in MSCI AC Asia ex Japan index as of end-June 2025. Analysis window June 2020 to June 2025.
Fig. 4. MSCI AC Asia ex Japan Index – weight of largest 3 sectors
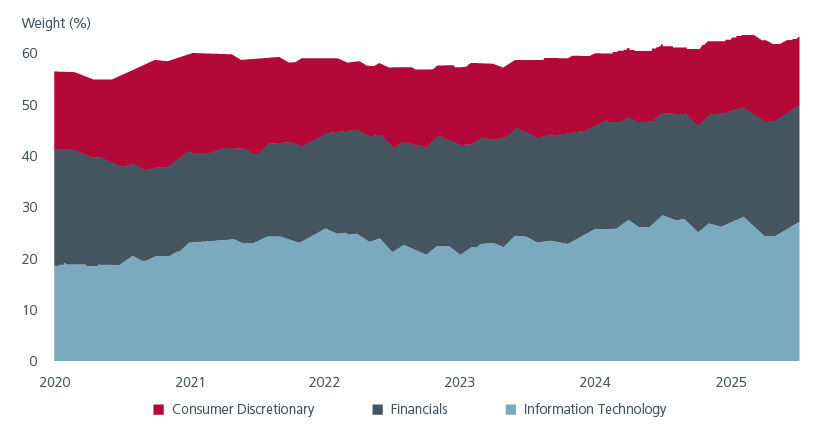
Source: Largest 3 GICS Sector by weight in MSCI AC Asia ex Japan index as of end-June 2025. Analysis window: June 2020 to June 2025.
The rising country and sector concentration in the MSCI AC Asia ex Japan index suggests that investors may be better off with an active approach; looking beyond the “popular” stocks as well as exploring opportunities outside the index. These opportunities often come with more attractive valuations.
Consider price-to-book (PB) – a simple measure of how much investors pay for a company’s net assets. Fig. 5 shows that the largest index constituents often trade at elevated price-to-book ratios, reflecting their popularity and perceived safety, while the smaller capitalised stocks tend to have lower P/B valuations.
Fig. 5. Trailing 12 months price-to-book (PB) across market-cap segments
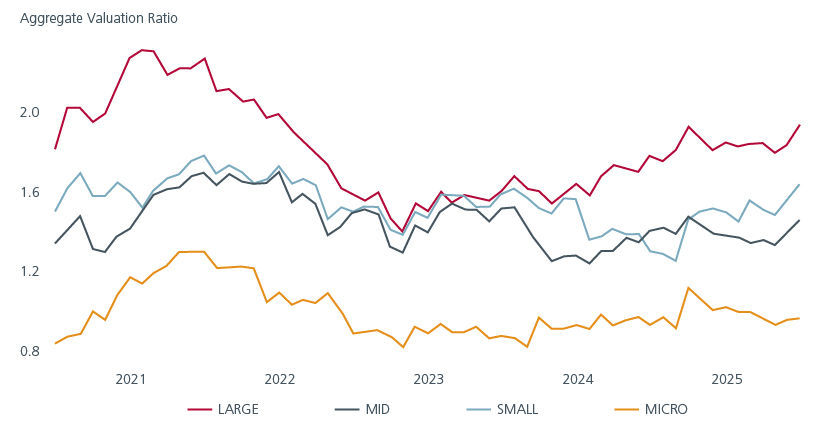
Source: Market cap segments are defined using typical index methodology. Companies are ranked from largest to smallest based on their total market capitalization. Then, using free float-adjusted market cap, the segments are as follows – Large: Constituents cumulatively making up 70% of the total free float-adjusted market cap, Mid Cap: up to 85%, Small Cap: up to 99%, Micro Cap: remaining 1%. July 2025. Analysis window: 1 June 2020 to 30 June 2025.
But do valuations matter? As wise sayings go, price is not the same as value.
We analysed the forward 1-year returns of the stocks within the MSCI AC Asia ex Japan index for the period between June 2020 to June 2024, categorising each stock according to their Value and Growth characteristics. Fig. 6.
- The top row represents the more expensive companies
- The left-most column represents companies with stronger growth characteristics
The average outcome from the expensive stocks (top two rows) is a loss of 2.7%. On the other hand, stocks which were more attractively valued (bottom two rows), delivered an average gain of 6.3%. In fact, the more attractively valued stocks delivered positive returns across all levels of growth potential, with the highest return of 10.1% coming from cheaply valued companies with the strongest growth characteristics. It is worth noting that expensive stocks, regardless of their growth potential, had lower returns.
This analysis shows that valuations matter and often, paying a premium for companies does not bring superior outcomes, regardless of their perceived growth potential.
Fig. 6. 1-year forward returns of stocks in the MSCI AC Asia ex Japan Index
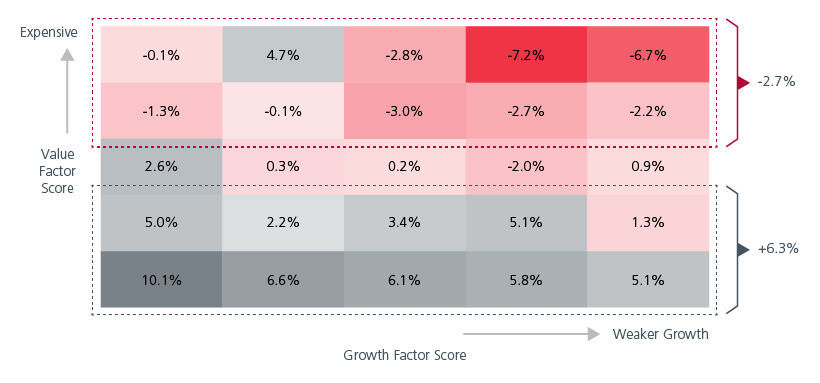
Source: Securities in our proprietary Asia ex-Japan universe are split into 25 fractiles based on their Value and Growth factor scores. Equal-weighted 1-year forward active returns, relative to MSCI AC Asia ex Japan index, are calculated for each fractile. Value Factor Score: Proprietary blend of valuation-related measures. Growth Factor Score: Proprietary blend of various growth, sentiment and valuation measures. July 2025. Analysis window: 1 June 2020 to 30 June 2025.
Navigating uncertainty: Why active now
2025 has been a year of surprises. Traditional market relationships have broken down. Defensive sectors have underperformed during risk-off periods. Currency movements have defied interest rate differentials. These anomalies suggest that historical playbooks may no longer apply.
The MSCI AC Asia ex Japan Index is increasingly concentrated and likely exposed to thematic hype. In this environment, active management is no longer a preference but a necessity. Active managers can interpret geopolitical developments, assess supply chain vulnerabilities, and anticipate policy shifts. They can adjust portfolios dynamically, manage risk proactively rather than being tethered to index weights.
For investors seeking long-term returns in Asia, the case for active management has never been stronger.
Interesting reads


The information and views expressed herein do not constitute an offer or solicitation to deal in shares of any securities or financial instruments and it is not intended for distribution or use by anyone or entity located in any jurisdiction where such distribution would be unlawful or prohibited. The information does not constitute investment advice or an offer to provide investment advisory or investment management service or the solicitation of an offer to provide investment advisory or investment management services in any jurisdiction in which an offer or solicitation would be unlawful under the securities laws of that jurisdiction.
Past performance and the predictions, projections, or forecasts on the economy, securities markets or the economic trends of the markets are not necessarily indicative of the future or likely performance of Eastspring Investments or any of the strategies managed by Eastspring Investments. An investment is subject to investment risks, including the possible loss of the principal amount invested. Where an investment is denominated in another currency, exchange rates may have an adverse effect on the value price or income of that investment. Furthermore, exposure to a single country market, specific portfolio composition or management techniques may potentially increase volatility.
Any securities mentioned are included for illustration purposes only. It should not be considered a recommendation to purchase or sell such securities. There is no assurance that any security discussed herein will remain in the portfolio at the time you receive this document or that security sold has not been repurchased.
The information provided herein is believed to be reliable at time of publication and based on matters as they exist as of the date of preparation of this report and not as of any future date. Eastspring Investments undertakes no (and disclaims any) obligation to update, modify or amend this document or to otherwise notify you in the event that any matter stated in the materials, or any opinion, projection, forecast or estimate set forth in the document, changes or subsequently becomes inaccurate. Eastspring Investments personnel may develop views and opinions that are not stated in the materials or that are contrary to the views and opinions stated in the materials at any time and from time to time as the result of a negative factor that comes to its attention in respect to an investment or for any other reason or for no reason. Eastspring Investments shall not and shall have no duty to notify you of any such views and opinions. This document is solely for information and does not have any regard to the specific investment objectives, financial or tax situation and the particular needs of any specific person who may receive this document.
Eastspring Investments Inc. (Eastspring US) primary activity is to provide certain marketing, sales servicing, and client support in the US on behalf of Eastspring Investment (Singapore) Limited (“Eastspring Singapore”). Eastspring Singapore is an affiliated investment management entity that is domiciled and registered under, among other regulatory bodies, the Monetary Authority of Singapore (MAS). Eastspring Singapore and Eastspring US are both registered with the US Securities and Exchange Commission as a registered investment adviser. Registration as an adviser does not imply a level of skill or training. Eastspring US seeks to identify and introduce to Eastspring Singapore potential institutional client prospects. Such prospects, once introduced, would contract directly with Eastspring Singapore for any investment management or advisory services. Additional information about Eastspring Singapore and Eastspring US is also is available on the SEC’s website at www.adviserinfo.sec. gov.
Certain information contained herein constitutes "forward-looking statements", which can be identified by the use of forward-looking terminology such as "may", "will", "should", "expect", "anticipate", "project", "estimate", "intend", "continue" or "believe" or the negatives thereof, other variations thereof or comparable terminology. Such information is based on expectations, estimates and projections (and assumptions underlying such information) and cannot be relied upon as a guarantee of future performance. Due to various risks and uncertainties, actual events or results, or the actual performance of any fund may differ materially from those reflected or contemplated in such forward-looking statements.
Eastspring Investments companies (excluding JV companies) are ultimately wholly-owned / indirect subsidiaries / associate of Prudential plc of the United Kingdom. Eastspring Investments companies (including JV’s) and Prudential plc are not affiliated in any manner with Prudential Financial, Inc., a company whose principal place of business is in the United States of America.