

Steven Gray, CFA
Head of Global Emerging Market &
Asia Regional Value Equities
Eastspring Singapore
Feb 2026|5 min read
Executive Summary
- Emerging Markets are under owned and undervalued after a decade of US equity dominance, despite improving fundamentals and recent outperformance.
- A weaker US dollar, accommodative global monetary policy and rising capital expenditure create favourable conditions for Emerging Markets equities.
- Stronger balance sheets, better governance and structural growth themes are improving Emerging Markets’ resilience and long-term return potential.
For over a decade, US equities have dominated global portfolios, buoyed by strong growth, tech innovation, and unprecedented liquidity. This era of “US exceptionalism” crowded out opportunities elsewhere, leaving Emerging Markets (EMs) under owned and undervalued. Today, structural shifts—ranging from a weakening US dollar to rising global capital expenditure - signal a new chapter for EMs. For institutional investors seeking diversification and long-term returns, EMs potentially offer compelling opportunities that merit serious consideration.
A turning point for EMs
At the end of 2025, the MSCI Emerging Markets Index was up 34% vs the S&P 500’s 18% return, the largest outperformance in 17 years1. Despite this outperformance, EMs remain deeply undervalued: at 13.5x forward price-to-earnings, they are 32% cheaper than Developed Markets (DMs) and a striking 40% cheaper than the US.2 EMs’ discount to the US on a price to book basis is also significant at 61%3. Add in the higher dividend yield versus the US and DMs, and the case for EMs is highly compelling.
Arguably, valuation alone usually has not been enough of a support for EMs. That said, when investor sentiment turns, valuation becomes a powerful driver. We see numerous tailwinds that suggest a turning point for EMs.
For one, the US dollar’s weakening trend is a game changer. Over the long term, there is a very strong inverse correlation between the trade-weighted dollar and EM/DM relative performance. Fig. 1. With the US Federal Reserve (Fed) poised to cut rates further and the Trump administration’s push for a weaker US dollar, this should be positive for the EMs. Furthermore, EMs have lower US sales revenue exposure (~13%) compared to Japan and Europe (~20%),4 making EMs’ earnings less sensitive to a weaker dollar, all else being equal.
Fig 1: EMs outperform during periods of US dollar weakness
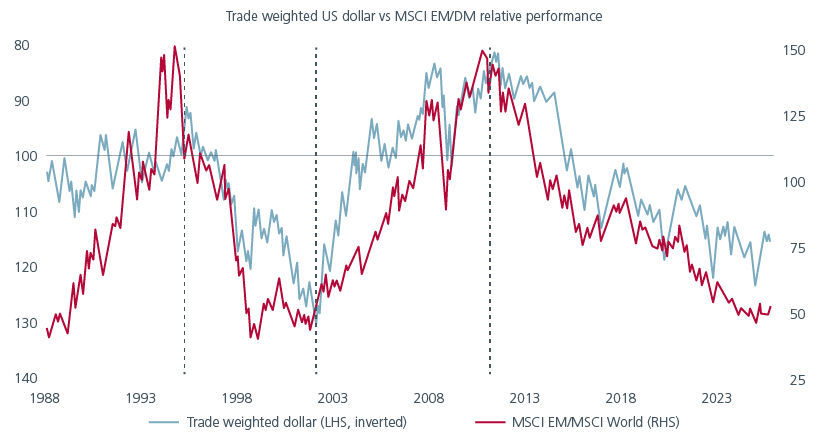
Source: CLSA, Federal Reserve, BIS, MSCI as at 24 October 2025. The use of indices as proxies for the past performance of any asset class/sector is limited and should not be construed as being indicative of the future or likely performance of the portfolio.
A weaker US dollar also allows EMs’ central banks to cut rates without worrying about currency stability. Historically, EMs outperform DMs during easing cycles — provided global growth is benign as it is now. The only times EMs did not outperform despite central bank easing was during the Asian currency crisis and Covid-19 pandemic. In the six most recent Fed easing cycles since 1989, EM equities rose by an average of 28% in the year following the first rate cut – provided the US avoided recession5. Emerging markets have significant room to lower interest rates, supported by the Fed’s easing cycle, contained inflation, and historically high market-weighted real rates of around 3%.
EMs also do well versus the DMs when their economic growth differential widens. Going into 2026, we expect growth in the US and Europe to be relatively steady while growth in EMs is being supported by fiscal and monetary policy stimulus. China’s commitment to keeping GDP growth close to 5% through 2030 suggests that new monetary and fiscal stimulus is likely, with cuts in requirement reserve ratio and interest rates, as well as potential investments in strategic industries such as technology, transportation and biotechnology. In addition, EMs perform strongly when global capital expenditure (capex) rises. With global capex increasing, EMs should benefit given their role as manufacturers and suppliers to the rest of the world.
Improved resilience
EMs’ fundamentals are also improving. Following the massive government balance sheet expansion in the DMs post COVID, EMs’ government debt stands at 62% of GDP, roughly half the level of the DMs at 123%6. Around 20% of US Federal Revenue goes to servicing interest on debt now versus c13% in 2015.7 Notably, since 2023, sovereign upgrades in EMs have outnumbered downgrades.
Meanwhile, although tariff uncertainty remains a headline risk, EMs are increasingly self-sufficient and less vulnerable to US tariffs than in the past. For example, more than 45% of exports from EMs go to other EMs. Fig. 2. At the same time, US tariffs have been applied selectively to date, leaving EMs relatively better off than Europe or Japan.
Fig. 2. EMs are increasingly self-sufficient
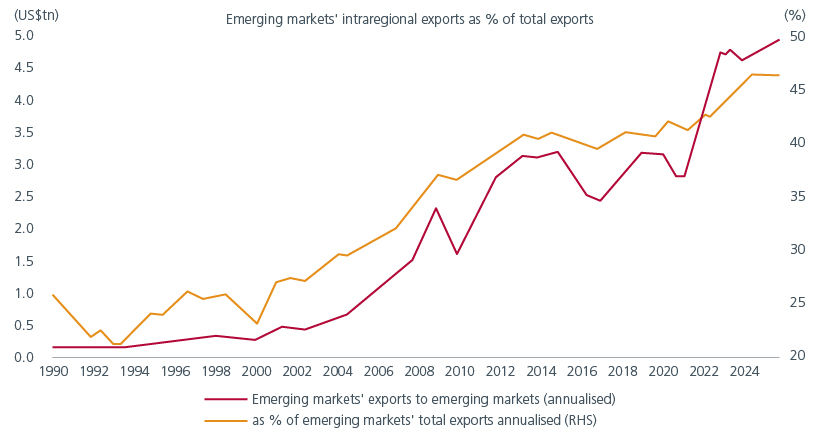
Source: IMF - Direction of Trade Statistics (DOTS), Datastream as at 15th July 2025.
Structural themes are also strengthening EMs’ resilience by improving long-term competitiveness and supporting sustainable growth. For example, Taiwan and South Korea anchor global semiconductor and AI ecosystems, offering exposure to secular growth trends. DeepSeek’s advancements have also accelerated innovation and competitiveness within China’s AI and broader technology ecosystem. Emerging economies are also central to the global energy transition, as they supply critical minerals such as lithium and cobalt, as well as renewable infrastructure, which underpins global decarbonisation efforts.
In addition, the middle class in EMs is forecasted to double over the next decade, expanding from about 354 million households in 2024 to 687 million by 20348. China and India will dominate this growth, but countries like Vietnam, Indonesia and Mexico are emerging as hotspots. This should drive discretionary spending, potentially benefitting the consumer discretionary, financial services, healthcare, as well as infrastructure and real estate sectors.
EMs’ improved fundamentals have not gone unnoticed. The International Monetary Fund’s (IMF) latest World Economic Outlook report highlighted that EMs’ economies have displayed a remarkable degree of resilience to global risk-off events since the Global Financial Crisis9. It notes that the implementation and credibility of monetary policy within EMs have gradually improved over time, helped by stronger policy frameworks. The IMF also lauded EMs’ stronger fiscal frameworks which have allowed fiscal policy in the region to help stabilise output during global slowdowns while improving their ability to stabilise debt. In our view, the resilience of EMs stands out, especially as DMs increasingly face political turbulence and challenges to central bank independence—conditions that once characterised EMs but now highlight their relative stability.
Why EMs lagged and why that is changing
The last decade of EMs underperformance stemmed from a variety of macro and micro related factors. From a macro perspective, a stronger US dollar and lower real interest rates were tailwinds for earnings in DMs, in particular the US. From a micro perspective, factors which have contributed to EMs’ weaker performance have included weaker relative earnings per share, driven by aggressive share issuance and corporate governance concerns.
At an aggregate level, EMs’ earnings have grown ahead of those in the US. This however has not translated into stronger earnings-per-share growth, due to aggressive share issuance across EMs. Fig. 3. This trend is now slowly improving, with greater control over the quality of Initial Public Offerings, more stringent oversight of capital increases from shareholders, increasing buybacks and higher dividends. As a result, EMs now offer a higher total yield than the US. There is scope for even stronger corporate governance in the future. India’s capital guidelines for public sector undertakings drove strong stock performance, while the China Securities Regulatory Commission has issued governance-focused reforms. Korea’s “value-up” efforts have lagged, but rising retail investor pressure may drive change, with nearly 70% of companies still trading below book value.
Fig. 3. EMs: Outperformance in earnings but underperformance in earnings-per-share
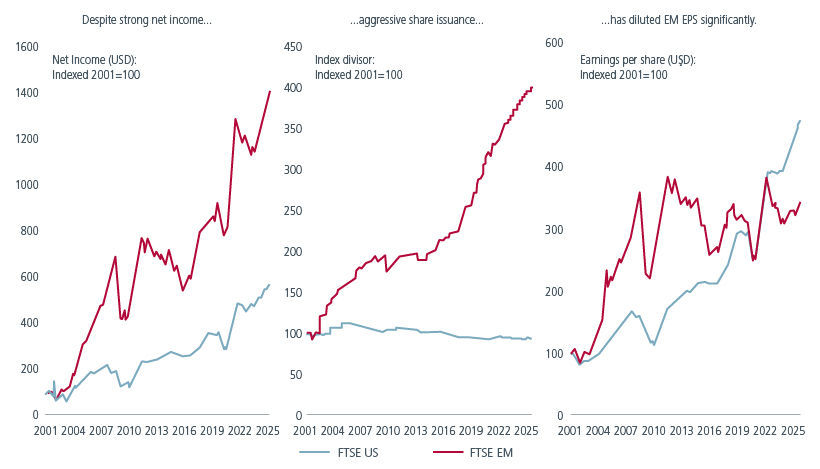
Source: FTSE Russell, Factset, HSBC as at 17 October 2025.
The underperformance of China equities in the last few years was also a significant drag on EMs. This can be seen from the stark divergence between MSCI EM’s 10% total return and MSCI World’s 70% over the four years to end-2024. Excluding both, MSCI EM ex-China returned 28%, nearly matching the performance of MSCI World ex-US at 30%.10
China’s strong performance in 2025 bodes well for EMs. Recent policy measures have provided support for the Chinese market and there is more positive government sentiment towards private enterprises. Meanwhile, initiatives such as the anti-involution policy may lead to a better focus on returns. China’s market rebound to date has been driven mostly by institutional flows from insurers, mutual funds and state funds. Foreign investors are still underweight and domestic retail investors remain on the sidelines. As such, Chinese households’ USD22tn in deposits could be a powerful catalyst for equity markets. With property investments losing appeal and deposit yields declining as policy rates fall, more of this liquidity is expected to migrate into equities. Going forward, stability in China’s equity market would help the relative performance of EMs versus DMs.
An active value approach
Following more than a decade of underperformance, we believe that the stars are aligned for EMs to outperform DMs. Emerging markets represent 84% of the global population and 61% of global GDP. In a world where economic gravity is shifting, EMs are not a peripheral play but central to achieving sustainable returns in the decade ahead. The investible universe spans more than 3,000 stocks across 24 countries, offering depth, diversification, and access to structural growth themes. Yet institutional allocations remain 600 to 700 basis points underweight relative to benchmarks11. This disconnect underscores a compelling opportunity for investors to reassess their positioning and capture the long-term potential of EMs.
An active approach is key to taking advantage of the market inefficiencies and diverse local dynamics in EMs. Lower broker coverage, higher retail participation and more challenging on-the-ground assessments create unique opportunities for active investors to add alpha. Fig. 4. Active management would also be needed to navigate the potential volatility which may arise from domestic politics, policy changes and global risk-off episodes.
Fig. 4. More opportunities for active investors in EM
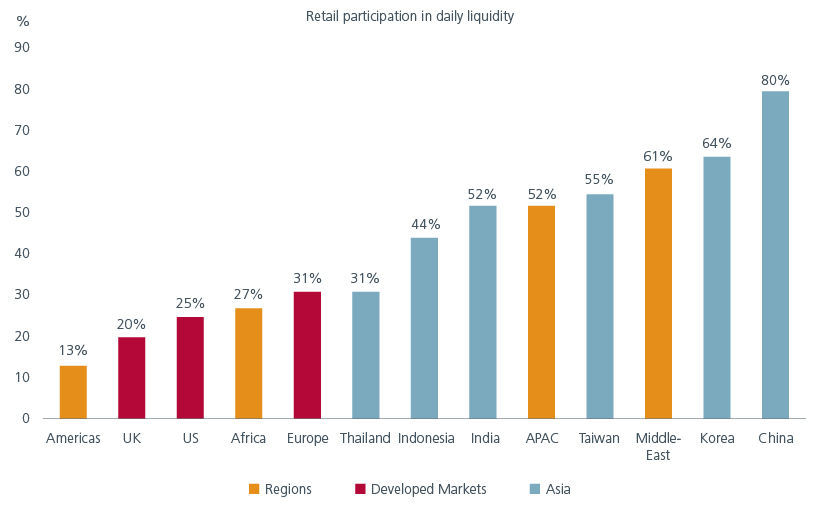
Source: IMF World Economic Outlook (WEO) Database, as at 30 April 2025.
Within EMs, the case for EM Value is even more compelling. EM Value largely magnifies the challenges and opportunities inherent in EMs. When EMs are unloved, capital tends to concentrate in a handful of high-growth, quality sectors, driving valuation dispersion to extremes. This is reflected in the widening gap between the price-to-earnings ratio of the most expensive and least expensive quartiles stocks in the universe. As investor interest returns to EMs, these valuation gaps typically narrow. For institutions seeking to position for higher beta as EMs regain ground against DMs, a strategic allocation to EM Value offers a differentiated and potentially rewarding approach.
This article appeared in the Winter 2026 issue of Communique, the quarterly newsletter of the Pension Investment Association of Canada.
Interesting reads


Sources:
1 Bloomberg. In USD terms. As of 31 December 2025.
2 MSCI Index Factsheets, As of 31 December 2025.
3 MSCI Index Factsheets. As of 31 December 2025.
4 UBS, Refinitiv Datastream, HOLT as at 25 June 2025.
5 HSBC Global Research. GEMs Equity Quarterly – The EM bull case is holding together. 11 July 2025.
6 IMF World Economic Outlook (WEO) Database, as at 30 April 2025.
7 CLSA . BEA.
8 Oxford Economics. The future of the middle class in emerging markets. October 2024.
9 IMF World Economic Outlook: Global Economy in Flux, Prospects Remain Dim. October 2025.
10 MSCI indices
11 Goldman Sachs. As of December 2025.
The information and views expressed herein do not constitute an offer or solicitation to deal in shares of any securities or financial instruments and it is not intended for distribution or use by anyone or entity located in any jurisdiction where such distribution would be unlawful or prohibited. The information does not constitute investment advice or an offer to provide investment advisory or investment management service or the solicitation of an offer to provide investment advisory or investment management services in any jurisdiction in which an offer or solicitation would be unlawful under the securities laws of that jurisdiction.
Past performance and the predictions, projections, or forecasts on the economy, securities markets or the economic trends of the markets are not necessarily indicative of the future or likely performance of Eastspring Investments or any of the strategies managed by Eastspring Investments. An investment is subject to investment risks, including the possible loss of the principal amount invested. Where an investment is denominated in another currency, exchange rates may have an adverse effect on the value price or income of that investment. Furthermore, exposure to a single country market, specific portfolio composition or management techniques may potentially increase volatility.
Any securities mentioned are included for illustration purposes only. It should not be considered a recommendation to purchase or sell such securities. There is no assurance that any security discussed herein will remain in the portfolio at the time you receive this document or that security sold has not been repurchased.
The information provided herein is believed to be reliable at time of publication and based on matters as they exist as of the date of preparation of this report and not as of any future date. Eastspring Investments undertakes no (and disclaims any) obligation to update, modify or amend this document or to otherwise notify you in the event that any matter stated in the materials, or any opinion, projection, forecast or estimate set forth in the document, changes or subsequently becomes inaccurate. Eastspring Investments personnel may develop views and opinions that are not stated in the materials or that are contrary to the views and opinions stated in the materials at any time and from time to time as the result of a negative factor that comes to its attention in respect to an investment or for any other reason or for no reason. Eastspring Investments shall not and shall have no duty to notify you of any such views and opinions. This document is solely for information and does not have any regard to the specific investment objectives, financial or tax situation and the particular needs of any specific person who may receive this document.
Eastspring Investments Inc. (Eastspring US) primary activity is to provide certain marketing, sales servicing, and client support in the US on behalf of Eastspring Investment (Singapore) Limited (“Eastspring Singapore”). Eastspring Singapore is an affiliated investment management entity that is domiciled and registered under, among other regulatory bodies, the Monetary Authority of Singapore (MAS). Eastspring Singapore and Eastspring US are both registered with the US Securities and Exchange Commission as a registered investment adviser. Registration as an adviser does not imply a level of skill or training. Eastspring US seeks to identify and introduce to Eastspring Singapore potential institutional client prospects. Such prospects, once introduced, would contract directly with Eastspring Singapore for any investment management or advisory services. Additional information about Eastspring Singapore and Eastspring US is also is available on the SEC’s website at www.adviserinfo.sec. gov.
Certain information contained herein constitutes "forward-looking statements", which can be identified by the use of forward-looking terminology such as "may", "will", "should", "expect", "anticipate", "project", "estimate", "intend", "continue" or "believe" or the negatives thereof, other variations thereof or comparable terminology. Such information is based on expectations, estimates and projections (and assumptions underlying such information) and cannot be relied upon as a guarantee of future performance. Due to various risks and uncertainties, actual events or results, or the actual performance of any fund may differ materially from those reflected or contemplated in such forward-looking statements.
Eastspring Investments companies (excluding JV companies) are ultimately wholly-owned / indirect subsidiaries / associate of Prudential plc of the United Kingdom. Eastspring Investments companies (including JV’s) and Prudential plc are not affiliated in any manner with Prudential Financial, Inc., a company whose principal place of business is in the United States of America.