


Executive Summary
- As traditional diversification between equities and bonds are proving less reliable in periods of market stress, investors are increasingly using Risk Management Overlays (RMOs) to limit portfolio drawdowns.
- A three pillar RMO approach i.e. Direct Hedging, Proxy Hedging and Carry Strategies is complementary and helps to mitigate risk without significantly compromising long-term returns
- RMOs represent a practical and robust enhancement to conventional portfolio construction, particularly in an environment of shifting macroeconomic correlations and increasing tail risks.
Investors have long allocated capital based on their expectations of future returns, volatilities and correlations, anchored in the principle that diversification across uncorrelated assets enhances a portfolio’s stability and reduces risk. This concept underpins the construction of multi-asset portfolios which usually comprise equities and bonds.
These two asset classes have historically moved in opposite directions, providing a natural hedge and supporting the long-standing resilience of the traditional 60/40 portfolio. However, recent events like the market dislocations of 2022 - when both equities and bonds fell in tandem amid aggressive central bank rate hikes—revealed that this negative correlation can break down.
Such breakdowns have highlighted the need for more robust risk management frameworks with investors increasingly turning to hedging strategies to protect against drawdowns.
Understanding and evaluating market drawdowns
A robust risk management framework must account for the nature and dynamics of market breakdowns, recognising how they emerge and evolve over time.
Key drawdown metrics include:
- Maximum drawdown – the peak-to-trough decline in portfolio value.
- Drawdown duration – the time from peak to trough.
- Recovery time – the time taken to recover from a drawdown back to the previous peak.
Drawdowns can vary significantly in form:
- Sharp drawdowns, such as the COVID-19 crash in early 2020, are sudden and severe
- Gradual drawdowns, like those during the 2022 rate-hiking cycle, unfold over time and can be more persistent.
Understanding drawdowns and their characteristics is essential in designing effective risk management overlays (RMO) for different market stress scenarios.
Hedging tail risks via risk management overlays
While hedges can protect against losses, they often come with a cost that erodes long-term performance. Yet, for many investors—particularly institutions with drawdown constraints—choosing not to hedge is not a viable option. This is where risk management overlays (RMOs) come into play.
RMOs are risk mitigating hedging strategies applied on top of a portfolio to hedge tail risks without compromising long-term returns of the portfolio. Rather than relying on a single hedge which can be expensive, a RMO is a structured hedging approach that addresses different types of drawdowns, allows for cost sharing across strategies and selective deployment of capital to where it is most effective.
We propose a three-pillar framework for constructing RMOs:
- Direct Hedging
This pillar includes instruments like put options that are designed to perform during sharp market corrections. These strategies offer strong negative correlation to portfolio assets and benefit from spikes in volatility. However, they come with a consistent cost of implementation.
- Proxy Hedging
This includes strategies that perform well in more gradual drawdowns. Examples include trend-following strategies or allocations to quality equities that can better withstand downturns.
- Carry Strategy
Carry strategies that generate returns to help offset the cost of the direct hedge. The selection of these strategies excludes those that are expected to underperform during negative market environments.
Case Study: 60/40 Portfolio with RMO
To illustrate the benefits of RMOs, we applied the three-pillar approach to a US-based 60/40 portfolio (60% S&P 500, 40% US Fixed Income), back tested over the period July 2012 to April 2025.
Despite strong long-term performance, the unhedged portfolio experienced notable drawdowns—e.g., in Q1 2020 (COVID-19) and throughout 2022 (inflation-driven sell-off). The RMO-hedged portfolio was constructed with the following allocation: 50% to Direct Hedge, 20% to Proxy Hedge, and 10% to Carry.
Fig 1: Comparative performance of portfolios (unhedged versus hedged)
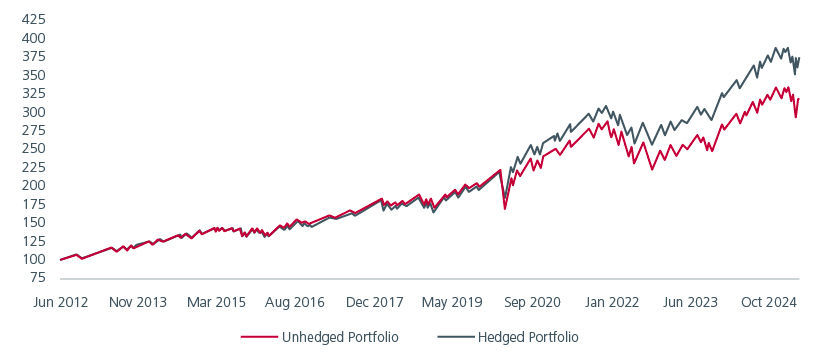
Source: Eastspring Investments and Bloomberg as of 30 April 2025
While the hedged portfolio slightly underperformed during strong up years (lagging by 50–200 bps annually), it significantly outperformed during tail-risk events, reducing drawdowns and accelerating recovery. This resulted in better risk-adjusted returns over the long term.
Fig 2: Selected statistics of drawdowns between July 2012 and April 2025
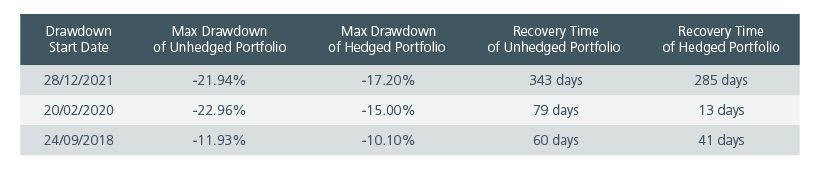
Source: Eastspring Investments and Bloomberg as of 30 April 2025
The performance metrics are better for the hedged portfolio than for the unhedged portfolio as returns are higher and realised volatility lower with shallower drawdowns.
Fig 3: Drawdown-based performance metrics
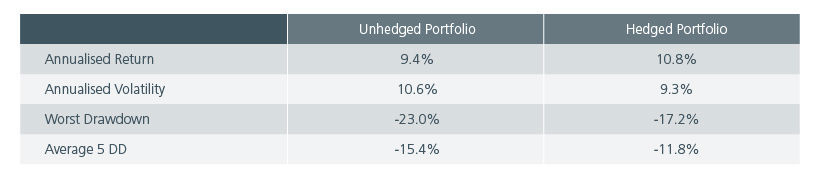
Source: Eastspring Investments and Bloomberg as of 30 April 2025
Balancing risk and return with RMOs
The three-pillar RMO framework offers a sophisticated approach to mitigating drawdowns in multi-asset portfolios. While RMOs may underperform unhedged portfolios during extended bull markets and face periods of negative contribution from proxy hedging and carry, these risks can be managed through strategic diversification and continuous performance monitoring.
Compared to traditional, options-based hedging methods, this diversified framework aims to address tail risks more effectively while minimising performance drag. As markets evolve, RMOs represent a valuable enhancement to modern portfolio construction.
Interesting reads


The information and views expressed herein do not constitute an offer or solicitation to deal in shares of any securities or financial instruments and it is not intended for distribution or use by anyone or entity located in any jurisdiction where such distribution would be unlawful or prohibited. The information does not constitute investment advice or an offer to provide investment advisory or investment management service or the solicitation of an offer to provide investment advisory or investment management services in any jurisdiction in which an offer or solicitation would be unlawful under the securities laws of that jurisdiction.
Past performance and the predictions, projections, or forecasts on the economy, securities markets or the economic trends of the markets are not necessarily indicative of the future or likely performance of Eastspring Investments or any of the strategies managed by Eastspring Investments. An investment is subject to investment risks, including the possible loss of the principal amount invested. Where an investment is denominated in another currency, exchange rates may have an adverse effect on the value price or income of that investment. Furthermore, exposure to a single country market, specific portfolio composition or management techniques may potentially increase volatility.
Any securities mentioned are included for illustration purposes only. It should not be considered a recommendation to purchase or sell such securities. There is no assurance that any security discussed herein will remain in the portfolio at the time you receive this document or that security sold has not been repurchased.
The information provided herein is believed to be reliable at time of publication and based on matters as they exist as of the date of preparation of this report and not as of any future date. Eastspring Investments undertakes no (and disclaims any) obligation to update, modify or amend this document or to otherwise notify you in the event that any matter stated in the materials, or any opinion, projection, forecast or estimate set forth in the document, changes or subsequently becomes inaccurate. Eastspring Investments personnel may develop views and opinions that are not stated in the materials or that are contrary to the views and opinions stated in the materials at any time and from time to time as the result of a negative factor that comes to its attention in respect to an investment or for any other reason or for no reason. Eastspring Investments shall not and shall have no duty to notify you of any such views and opinions. This document is solely for information and does not have any regard to the specific investment objectives, financial or tax situation and the particular needs of any specific person who may receive this document.
Eastspring Investments Inc. (Eastspring US) primary activity is to provide certain marketing, sales servicing, and client support in the US on behalf of Eastspring Investment (Singapore) Limited (“Eastspring Singapore”). Eastspring Singapore is an affiliated investment management entity that is domiciled and registered under, among other regulatory bodies, the Monetary Authority of Singapore (MAS). Eastspring Singapore and Eastspring US are both registered with the US Securities and Exchange Commission as a registered investment adviser. Registration as an adviser does not imply a level of skill or training. Eastspring US seeks to identify and introduce to Eastspring Singapore potential institutional client prospects. Such prospects, once introduced, would contract directly with Eastspring Singapore for any investment management or advisory services. Additional information about Eastspring Singapore and Eastspring US is also is available on the SEC’s website at www.adviserinfo.sec. gov.
Certain information contained herein constitutes "forward-looking statements", which can be identified by the use of forward-looking terminology such as "may", "will", "should", "expect", "anticipate", "project", "estimate", "intend", "continue" or "believe" or the negatives thereof, other variations thereof or comparable terminology. Such information is based on expectations, estimates and projections (and assumptions underlying such information) and cannot be relied upon as a guarantee of future performance. Due to various risks and uncertainties, actual events or results, or the actual performance of any fund may differ materially from those reflected or contemplated in such forward-looking statements.
Eastspring Investments companies (excluding JV companies) are ultimately wholly-owned / indirect subsidiaries / associate of Prudential plc of the United Kingdom. Eastspring Investments companies (including JV’s) and Prudential plc are not affiliated in any manner with Prudential Financial, Inc., a company whose principal place of business is in the United States of America.